,
Machine Learning
01 Background
" If you can build a simple rule-based system that doesn't require machine learning, do that" - Number 1 rule of Google's Machine Learning Handbook
Resources
- ML Cheatsheet
- Dive Into Deep Learning https://d2l.ai
- 🖊 Improve on how “Strategies to Improve ML Models”
- ❓ What is gradient boosting?
- ❓ What is ensembling?
- ❓ What is cross validation?
- ❓ What is gradient boosting?
- ❓ What is the difference between prediction and inference?
- ❓ What is multi-modal learning
- ❓ What is data augmentation
任务 What is the difference between pretext tasks and downstream tasks?
- 任务 Example Task 🛫 2024-03-06 📅 2024-03-12
Mind Map of ML Universe
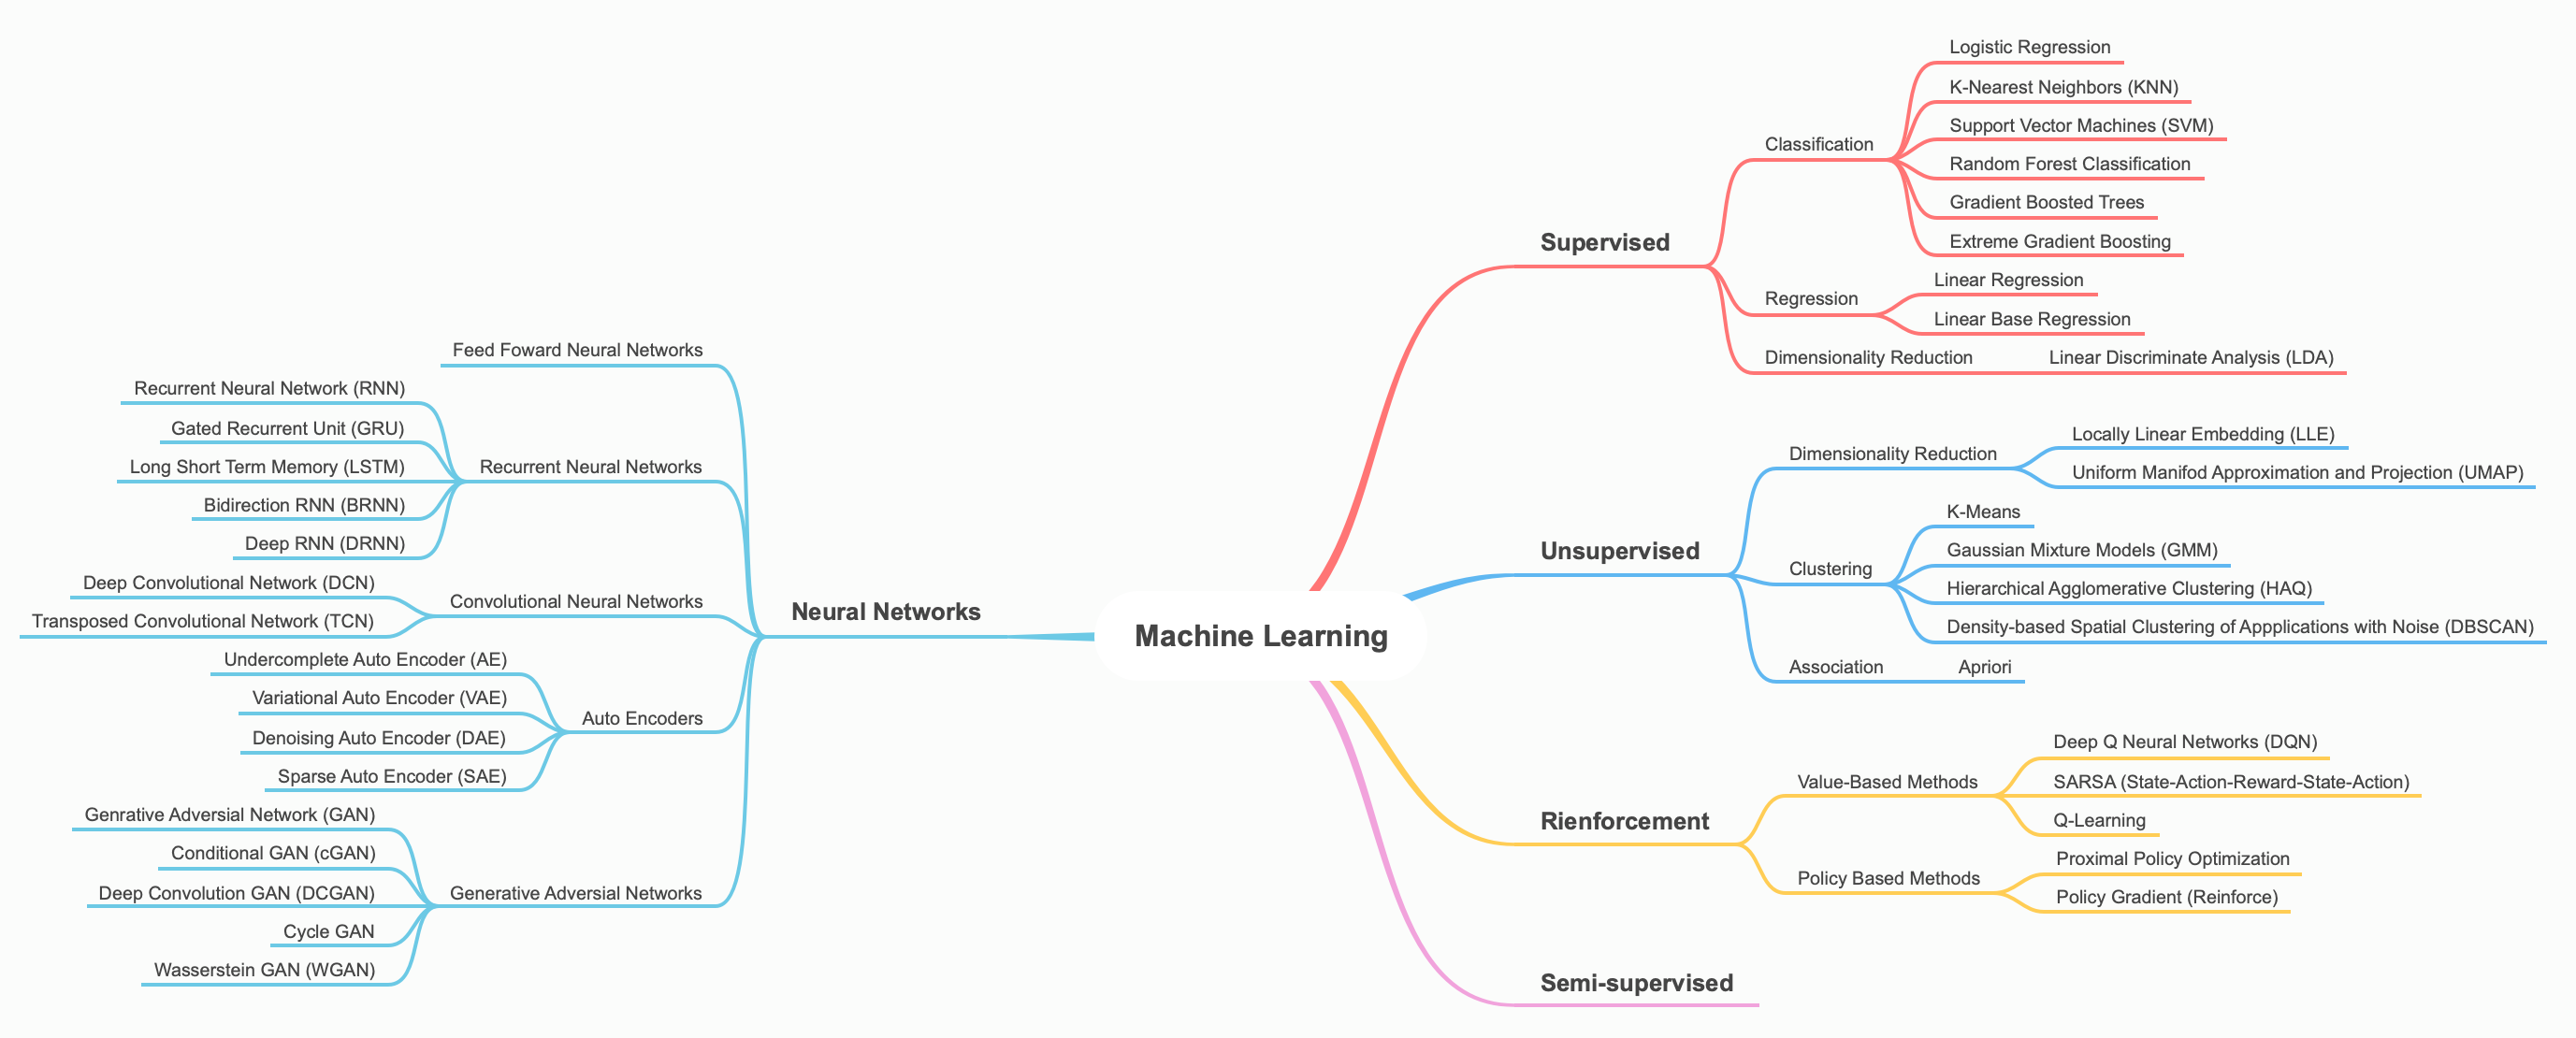
Indexing ML Notes
- Supervised Machine Learning
- Unsupervised Machine Learning
-
Semi-supervised Machine Learning
- Self-supervised Machine Learning
- Reinforcement Learning
- Neural Networks
02 ML Concepts
These are some important key concepts in machine learning.
What is the difference between Algorithms, Machine Learning, Artificial Intelligence, Neural Networks, and Deep Learning?
The Importance of Statistics in Machine Learning
It is important to study the math and Statistics behind many classic machine learning approaches. Heavily inspired by Machine Learning, A Probabilistic Approach
Generalization, Overfitting and Underfitting
If a model is able to make accurate predictions on unseen data, we say that it is able to generalize from the training set to the test set. This is important if the training and test data are not similar.
A model can be super complex and specific for the training set. For example, for the data set about customers who bought a boat.
| Age | Number of cars owned | Owns house | Number of Children | Marital Status | Owns a dog | Bought a boat |
|---|---|---|---|---|---|---|
| 66 | 1 | yes | 2 | widowed | no | yes |
| 52 | 2 | yes | 3 | married | no | yes |
| 22 | 0 | no | 0 | married | yes | no |
A complex model would have the following rule. If the customer is older than 52, has less then three children, and doesn’t own a dog. This might fit well for this data set, but would fail when more entries are added. This is overfitting.
Under-fitting rule might be: Anyone over age of 50 might buy a boat. This fails to consider any other feature other than age, and thus unable to capture the relationship between features and target.
Let’s look at some training/testing/validation accuracy graphs to visualize when a model might be considered under-fitting, just right, or overfitting of a Linear Regression.
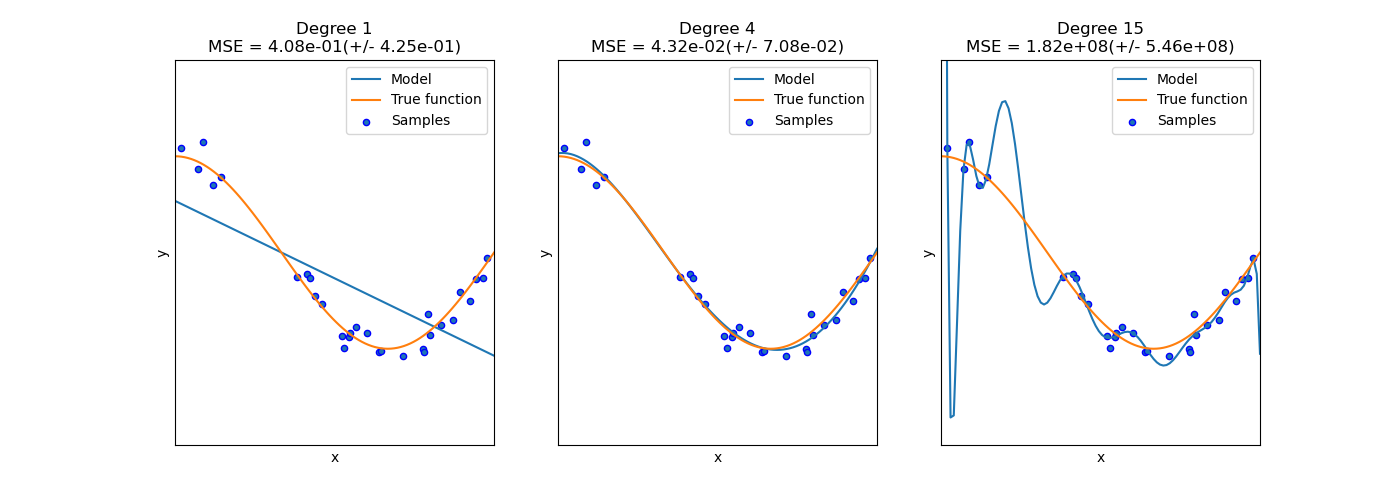 This idea is also vital to neural network models, where we often visualize under-fitting/overfitting in loss and accuracy graphs (after a model training).
Bias and Variance
Bias is the inability for a ML algorithm to capture true relationship. (Large Bias vs Small Bias)
 The linear relationship on the left has large bias, while the relationship on the right has small bias. Which can be measured with Mean Squared Error.
Variance can be described as in the difference between fits between datasets. Imagine the blue dots as the training set, and green as test set. We can see that the straight line actually does better than the squiggly line relationship with a smaller bias. Thus the straight line is considered to have low variance.
 The squiggly line therefore has low bias, but high variability because it results in vastly different sum of squares for different datasets. It is hard to predict how well the squiggly line might do for future datasets.
 Another thing to consider in this case is that the squiggly line is Overfitting because it works extremely well for the test set, but poorly for the test set. Another popular example,
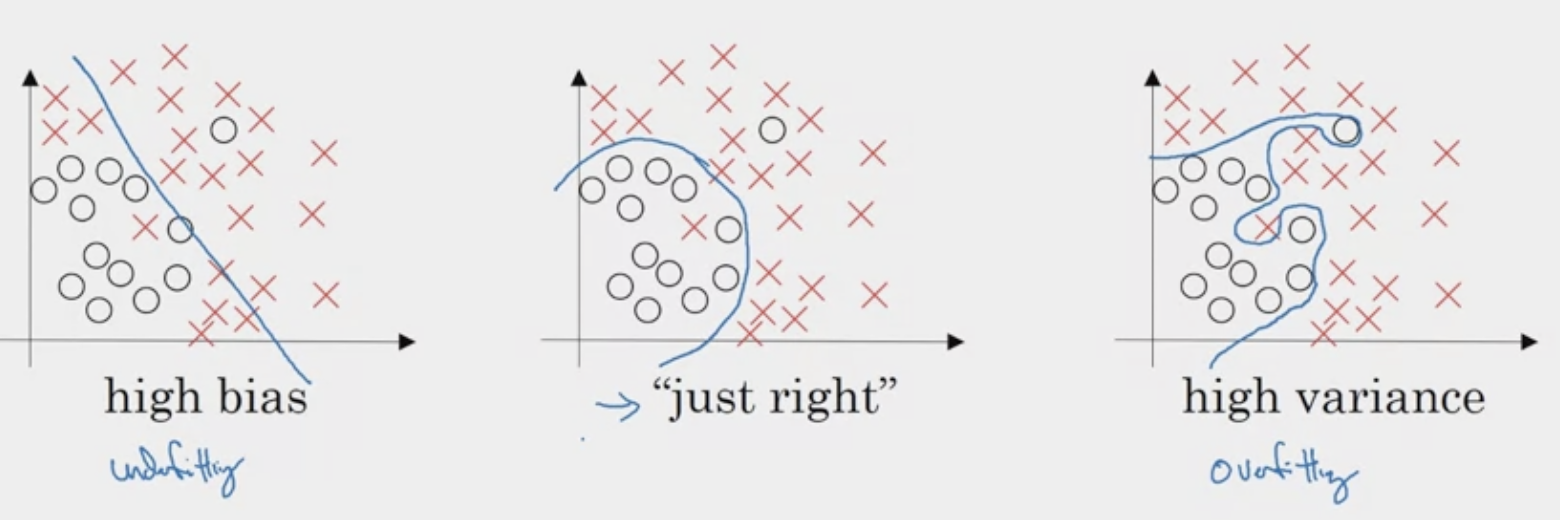 How about in higher dimensions where we can’t simply visualize? We can use train set error vs dev set error. For example, in a cat classification where we have
| Error Type | Case 1 | Case 2 | Case 3 | Case 4 |
|---|---|---|---|---|
| Human Error | 0% | 0% | 0% | 0% |
| Train Set Error | 1% | 15% | 15% | 0.5% |
| Dev Set Error | 11% | 16% | 30% | 1% |
| Bias/Variance | High Variance | High Bias | High Bias & High Variance | Low Bias/Variance |
Human Error & Optimal Bayes Error are standards that determine whether train set error is high bias/low bias.
Remark: Error can be denoted as
Regularization
Regularization
Intuition: Regularization methods add a penalty term to the model’s loss function to discourage it from learning overly complex patterns that may not generalize well (prevent overfitting, reduce variance). Take the following regression example below.
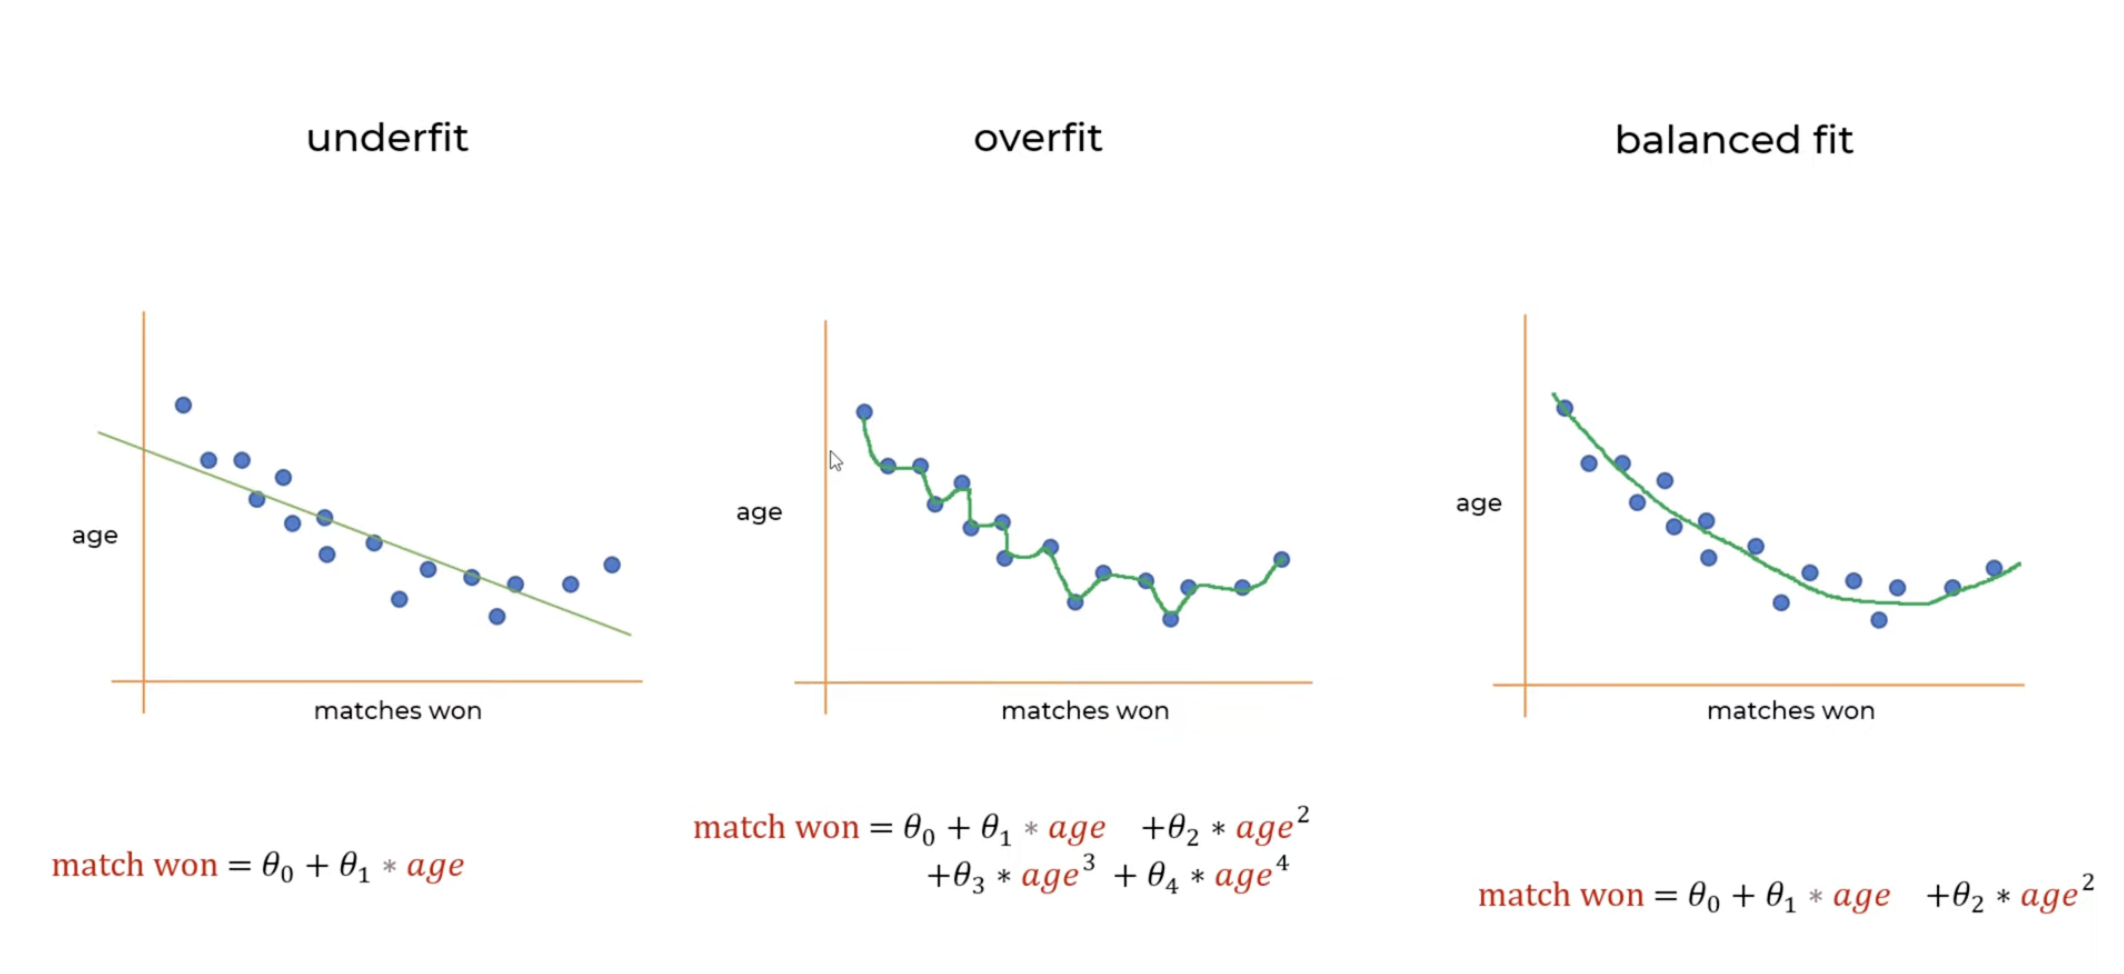 Our goal is to shift from overfit to balanced fit. So how do we do that? We should try to make and approach 0 to get a better prediction. Remember that when starting a regression model, we calculate mean squared error
on some randomly initialized weights (coefficient). Where is
Our goal is to minimize this error. So what if we add a parameter to the end.
where is the regularization paramter, or a turning nob. In this case, if gets bigger, so will the error, the second part will also get bigger, and in turn the error gets bigger. And the model will not converge. This is known as L2 Regularization. We can see that we are penalizing extreme parameter values, such as he high parameter.
Regularization significantly reduces the variance of the model, without substantial increase in its bias. Tuning the parameter used in regularization techniques described above, controls the impact on bias and variance.
- As the value of λ rises, so does the regularization strength. Till a point, this increase in λ is beneficial as it is only reducing the variance(hence avoiding overfitting), without loosing any important properties in the data. But after certain value, the model starts loosing important properties, giving rise to bias in the model and thus under-fitting. Therefore, the value of λ should be carefully selected.
Types of Regularization
- Ridge (L2) Regression
- Lasso (L1) Regression
What are Word Embeddings?
Here we answer a few questions:
- What is a neural language model?
- What are word embeddings?
- What are Word2Vec, Negative Sampling, Skip-Gram, and GloVe?
What is Neural Language Model? These models use neural networks to predict the likelihood of a sequence of words. Traditional language models, before the advent of neural networks, relied on statistical methods like n-grams, which would predict the probability of a word based on the previous ‘n-1’ words. However, these models had limitations, particularly in handling long-term dependencies and large vocabularies. This led a shift to RNN’s and later transformers.
What are Word Embeddings? Word embeddings are ways to represent words, through dense vector representations, that capture semantic information about the words. These embeddings are then used as input features into neural language models, enhancing their ability to understand text. For example, word embeddings can learn analogies. Representations include
- 1-hot representation
- feature representation (aka embeddings)
What is 1-Hot Representation? In a one-hot representation, each element in a set is represented as a vector where only one component is ‘hot’ (i.e., set to 1), and all other components are ‘cold’ (i.e., set to 0). However, one-hot vectors result in high dimensional sparse vectors that do not capture any semantic information. For example.
| Words | Man (5391) | Woman | King | Queen | Apple | Orange |
|---|---|---|---|---|---|---|
| Man | 1 | 0 | 0 | 0 | 0 | 0 |
| Woman | 0 | 1 | 0 | 0 | 0 | 0 |
| King | 0 | 0 | 1 | 0 | 0 | 0 |
| Queen | 0 | 0 | 0 | 1 | 0 | 0 |
| Apple | 0 | 0 | 0 | 0 | 1 | 0 |
| Orange | 0 | 0 | 0 | 0 | 0 | 1 |
What is Feature Representations? Encodes semantic information for each word.
| Features/Words | Man (5391) | Woman | King | Queen | Apple | Orange |
|---|---|---|---|---|---|---|
| Gender | Male | Female | Male | Female | N/A | N/A |
| Royal | No | No | Yes | Yes | No | No |
| Living | Yes | Yes | Yes | Yes | No | No |
| Edible | No | No | No | No | Yes | Yes |
| Color | Various | Various | Various | Various | Red/Green | Orange |
In a vector space, this might be represented as
| Features/Words | Man (5391) | Woman | King | Queen | Apple | Orange |
|---|---|---|---|---|---|---|
| Gender | 0.5 | 0.5 | 0.5 | 0.5 | 0.0 | 0.0 |
| Royal | 0.0 | 0.0 | 1.0 | 1.0 | 0.0 | 0.0 |
| Living | 1.0 | 1.0 | 1.0 | 1.0 | 0.0 | 0.0 |
| Edible | 0.0 | 0.0 | 0.0 | 0.0 | 1.0 | 1.0 |
| Color | 0.5 | 0.5 | 0.5 | 0.5 | 0.5 | 1.0 |
This is a small table, when in reality, each word may have a large number, 300, for example, feature vector/embedding. The encoded information allows algorithms to quickly figure out the relationship between words. For example, man and woman would have a stronger relationship than man and orange. It also allows us to form analogies between words as shown below.
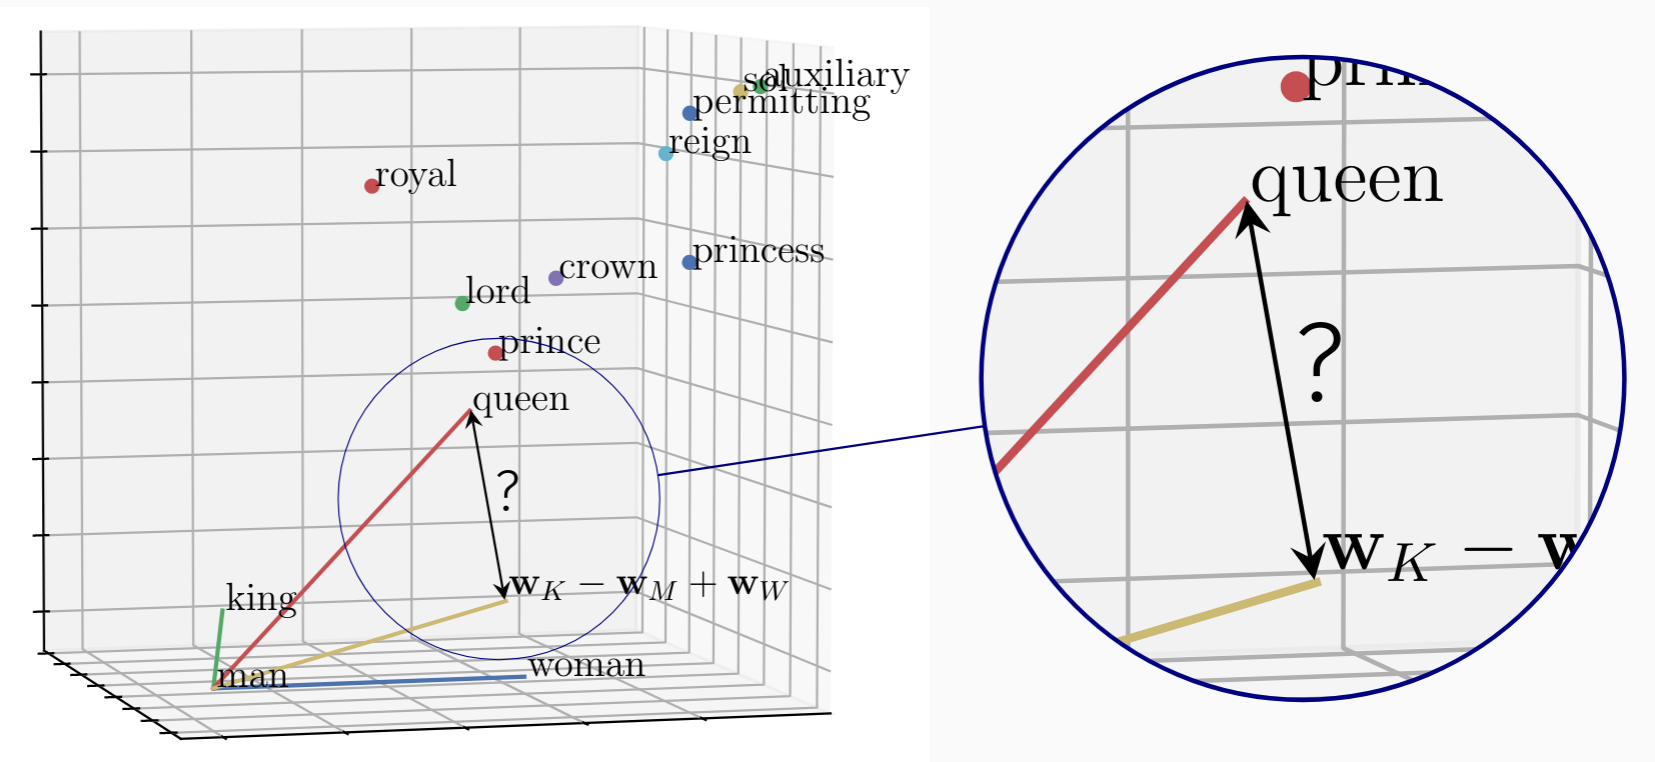
One common algorithm, t-SNE (introduced by Van Der Maaten and Hinton) projects these 300 dimensional word embeddings on a 2D plot and makes it easy to similar words. Below, each color represents a group of similar words.
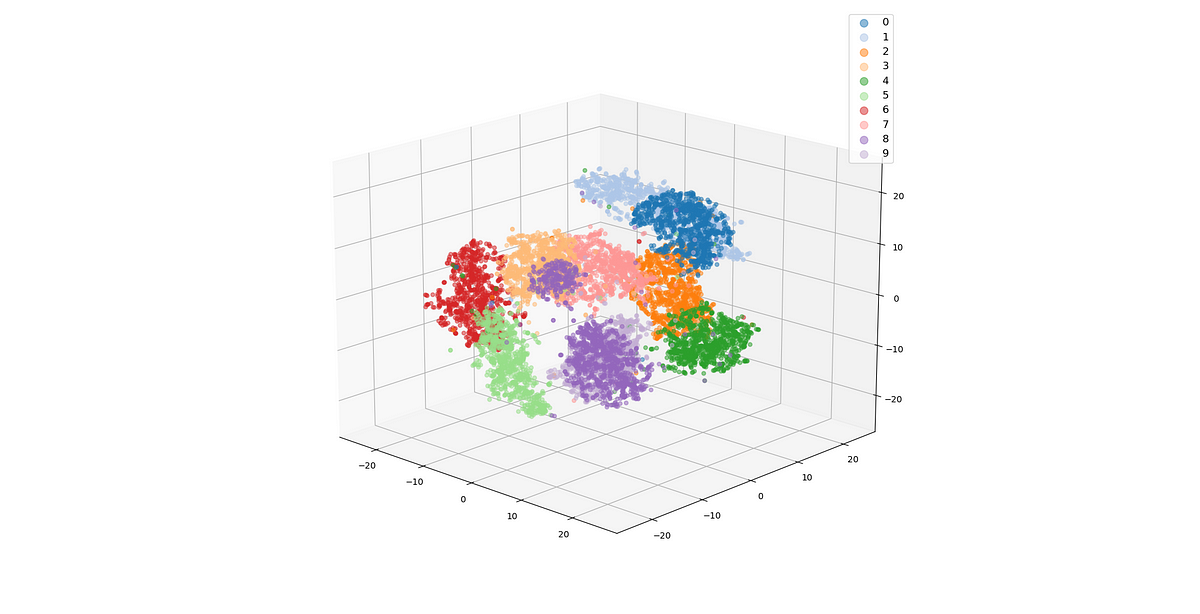
Embedding Matrix? An embedding matrix is a list of all words and their corresponding embeddings. In order to get the embedding vector for a specific word. We can multiply the word embedding matrix by the word’s one-hot rperesentation.
What is Word2Vec? The Word2Vec is a collection of architectures and optimizations to learn word embeddings from large datasets. There are a few popular methods including skip-gram, CBOW, and negative sampling
What Skip-gram? Introduced in [Mikolov et. al., 2013, Efficient estimation of word representations in vector space].
Let’s assume the you are given the following sentence: We come up with a few context to target pairs. Rather than having the context simply be the next words or previous words around the target, instead, we randomly pick a word to be the context word. For example, let’s say the target word is . Then randomly pick a target word within a certain window, perhaps words. You could choose:
| Context | Target |
|---|---|
| orange | juice |
| orange | glass |
| orange | my |
A supervised learning model, where given the context word, you are asked to predict what is a randomly chosen word within that window. In other words, learn the mapping from some context to a target .
Let’s define the model
- Uses softmax classification
- Different classifiers - Hierarchical Softmax
- Softmax calculation is computationally expensive.
What is CBOW?
What is Negative Sampling? Modified skip-gram to improve efficiency. Introduced in [Mikolov et. al., 2013, Distributed representation of words and phrases and their compositionality]
Using the same example above, we create a new supervised learning model that uses the a context, word, and target?. Context and word are chosen as in context and target in skip-gram. It is then associated to target?, which defines whether or not something is a context pair, and labels it either positive (1) or negative (0). For example
| Context (c) | Word (t) | Target? (y) |
|---|---|---|
| orange | juice | 1 |
| orange | king | 0 |
| orange | book | 0 |
| orange | the | 0 |
| orange | of | 0 |
The positive and negative examples are generated through sampling words in a window. Here, only the first line is the positive example. The rest examples are negative. The new supervised model takes the context and word as the features, and has to predict target?.
The problem is really, given a pair of words like and , do they appear together? Did we get these two words by sampling two words close to each other? Or do you think I got them as one word from the text and one word chosen at random from the dictionary. Our goal is to try to distinguish between these two types of distributions.
Let’s define the model.
Our goal is to use this formula to estimate the probability that . For every positive example, there are negative examples. In essence, we train a logistic regression model. Let’s visualize as a neural network.
10K possible logistic regression classification problems. One of these will be a classifier corresponding to the correct target word , as well as other words.
Think of it as having. a 10,000 binary logistic classifier. But instead of training all 10K on every iteration, we only train of them, 1 positive and negatives. This is much cheaper than updating a 10,000 way softmax in Skip-Gram.
How are negative examples sampled?
- Sample according to empirical frequency, but this results in high probability of words like “the, of, and”.
- Sample uniformly random, but this is not very representative o a language.
- Instead, take a heuristic value.
What is GloVe? Introduced in [Pennington et. al., 2014, GloVe: Global vectors for word representation]. Let’s define key term.
Or in other words, how many times appears in the context of . Now let’s define the model as
In plain text, we want to minimize the difference between and . We want to know how related these two terms are.
Our goal is to use gradient descent to solve for and .
More details can be found here
How to solve bias in word embeddings? Word embeddings can reflect gender, ethnicity, age, sexual orientation, and other biases of the text used to train the model. For example
- Identify bias direction
- Neutralize: For every word that is not definitional, project to get rid of bias.
- Equalize pairs
Strategies to Improve Neural Network Models
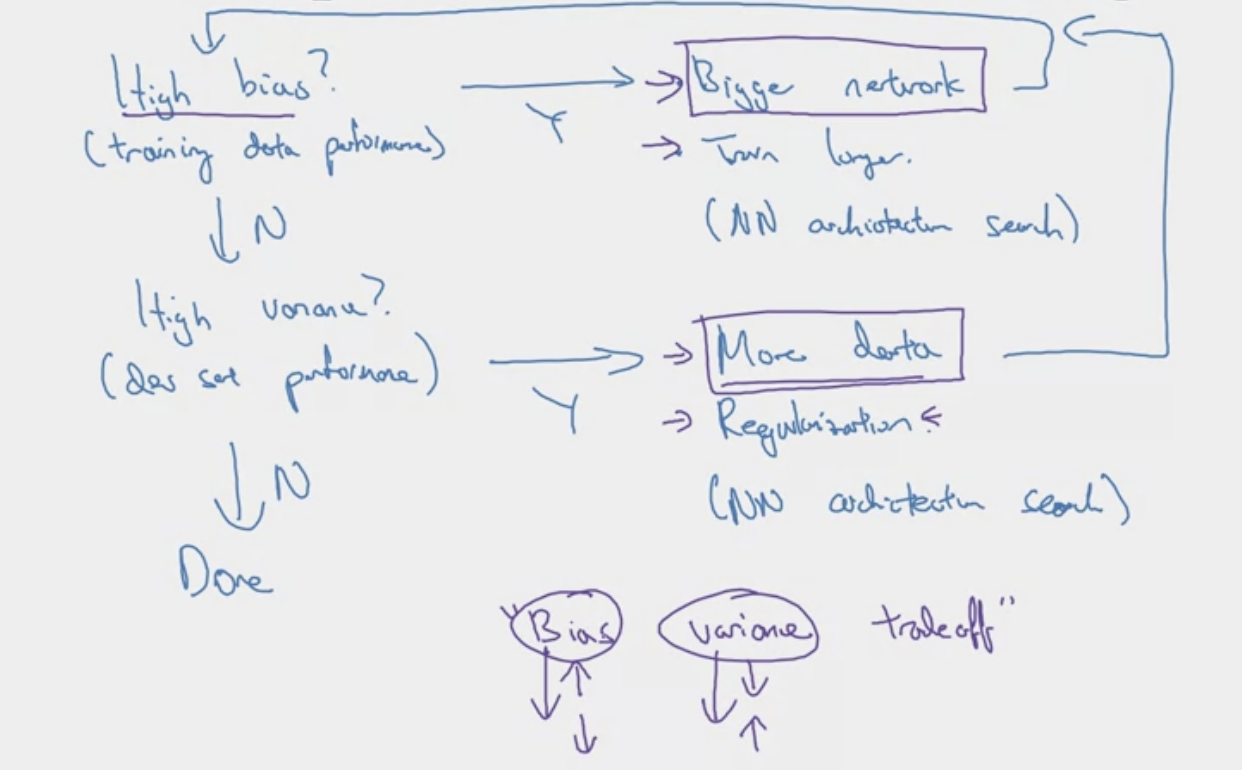
There are many ways to select and improve a models performance. Here we talk about general methods to do so. For neural networks specifically, refer to how to iteratively tune your model?
- Chain of Assumptions in ML
- Fit train set well on cost function (solve high bias)
- Fit dev set well on cost function (solve variance)
- Fit test set well on cost function
- Performs well in real world
- Orthogonalization
- Early stopping is less orthogonalized, bc effects both training and test set.
- Setting up your goal: Metrics
- Single number evaluation metric
- Satisficing and Optimizing Metric
- Changing Dev/Test Metrics (better capture real world metrics)
- Human-level Performance
- Bayes Optimal Error / Avoidable Bias
- Focus on bias when Training/Human far apart. Focus on variance when Training/Human area already close, but Dev error is not yet.
- Error Analysis
- can help make much better prioritization decisions
- DL algorithms are quiet robust to training set, small random label errors might not affect, but lets robust to systematic errors
- Build first system quickly, then iterations
- Mismatched Training and Dev/Test Set Distributions
- Put different distribution test cases into dev set and test set, rather than shuffling all test cases, then splitting into train/test/dev .
- When the training and dev set now have a large error, you can not safely draw the conclusion that it is due to variance.
- How to solve? Carry out manual error analysis to try to understand difference between training and dev/tests, make training data more similar. Or, artificial data synthesis (but this may only simulate a small subset of what we want to test on. I.e, generating cars from images taken from a game, game has limited)
- Transfer Learning
- Take trained parameters from a model that’s been on a giant dataset and use it for another application
- Multi-task learning: (1) training on a set of tasks that could benefit from having shared lower-level features. (2) Usually, if amount of data you have for each task is quite similar. (3) Can train a big enough neural network to do well on all tasks, can hurt if NN is not big enough
- End-to-End Deep Learning
- skip a task that usually requires a pipeline, replace with a DNN instead, but requires a large data set
- pros: don’t force human perceptions, conceptions, less-hand designing of components
What is Self-supervised Learning?
https://www.ibm.com/topics/self-supervised-learning