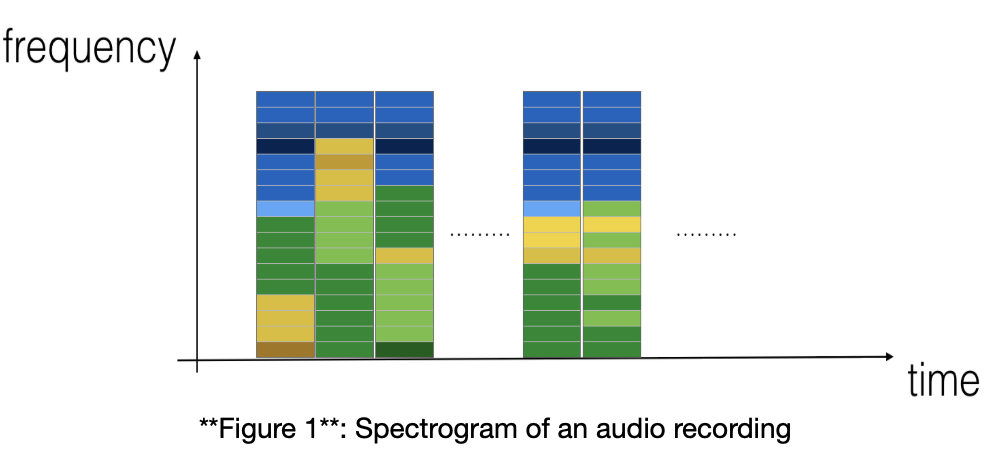
- A spectrogram is computed by sliding a window over the raw audio signal, and calculating the most active frequencies in each window using a Fourier transform.
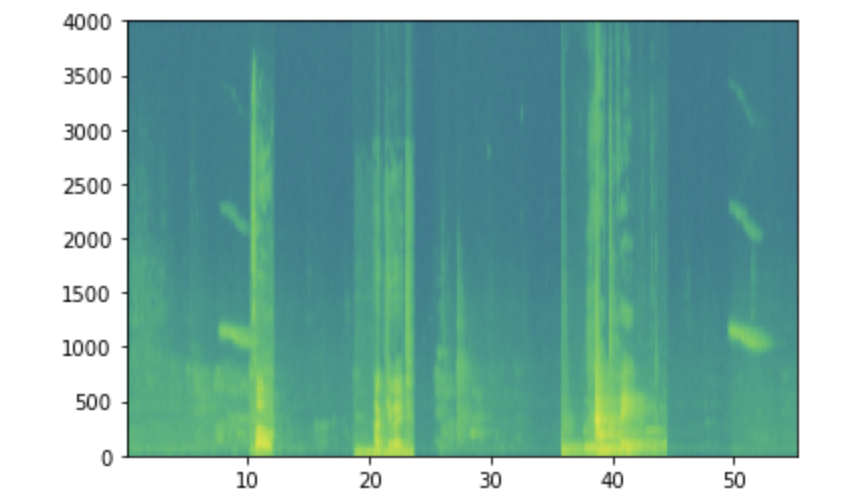
Below is a spectrogram of an audio clip saying a trigger word “activate” twice.
 The graph above represents how active each frequency is (y axis) over a number of time steps (x axis).
 The color in a spectrogram shows the degree to which different frequencies are present (loud) in the audio at different points in time.
- Green means a certain frequency is more activate or more present in the audio clip (louder)
- Blue squares denote less active frequencies.
- The dimension of the output spectrogram depends upon the hyperparameters of the spectrogram software and the length of the input.